Case study · Cost of a Click
Cost of a Click
Making AI’s invisible water cost physically tangible.
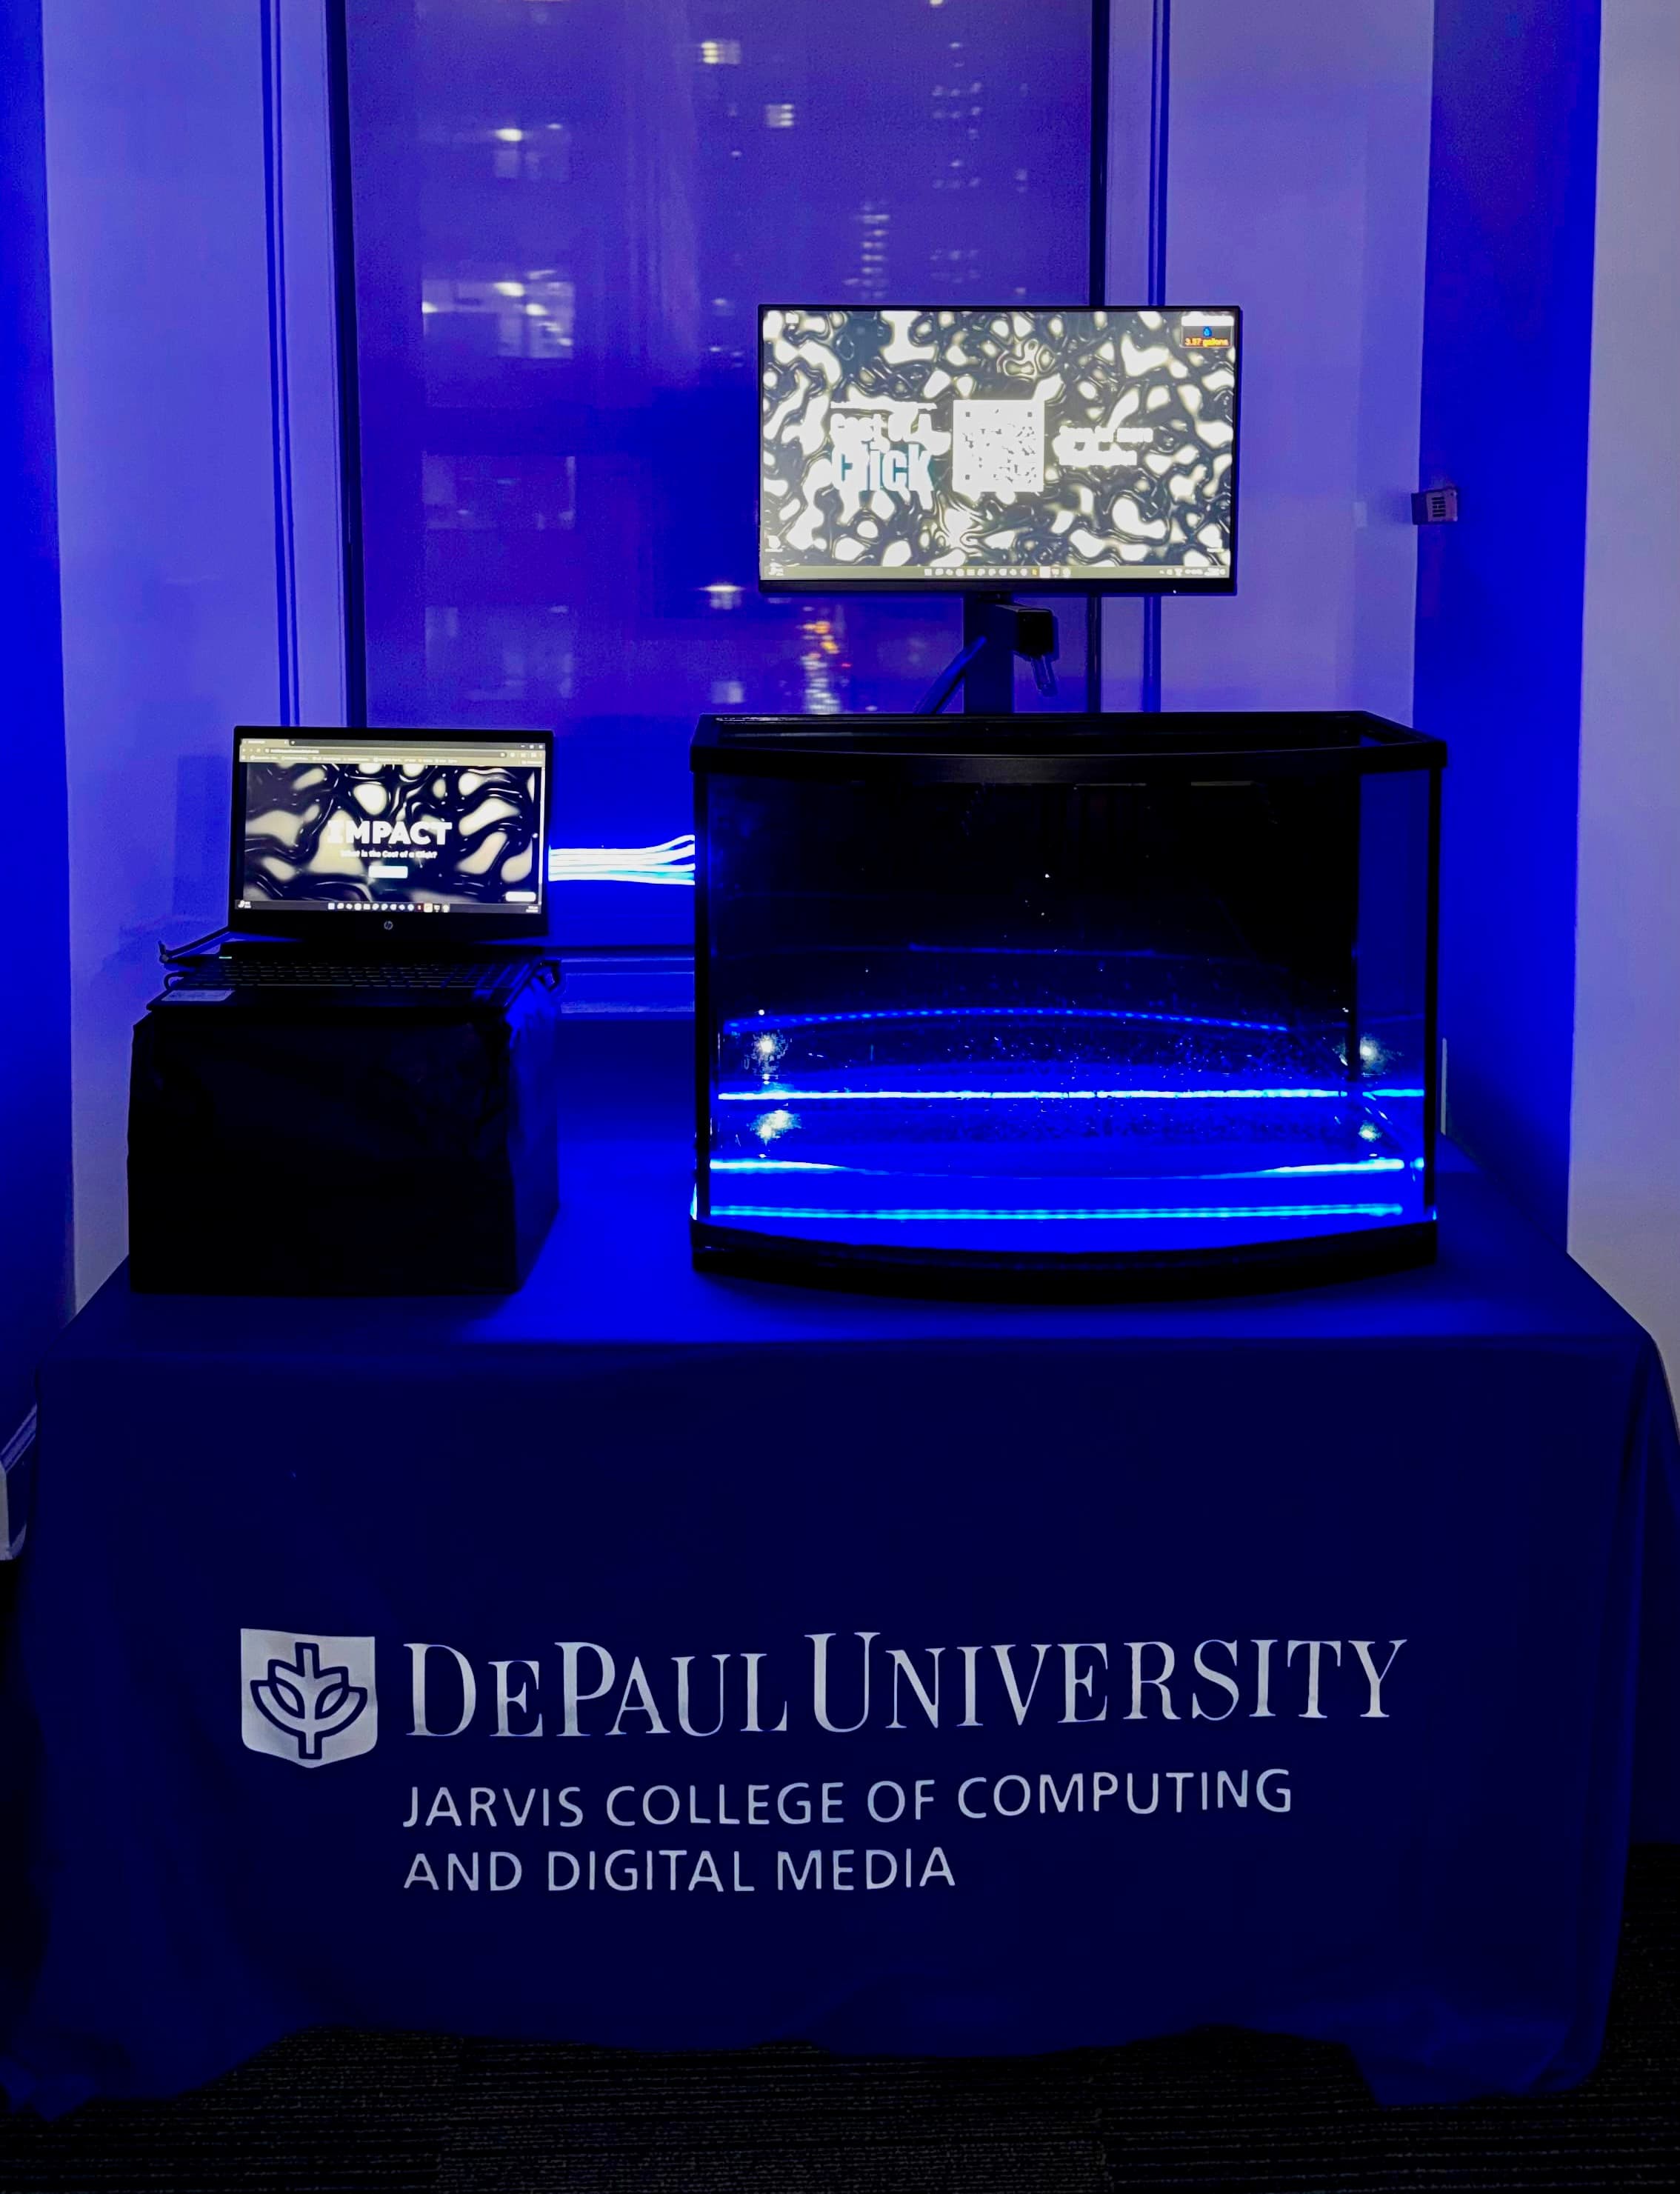
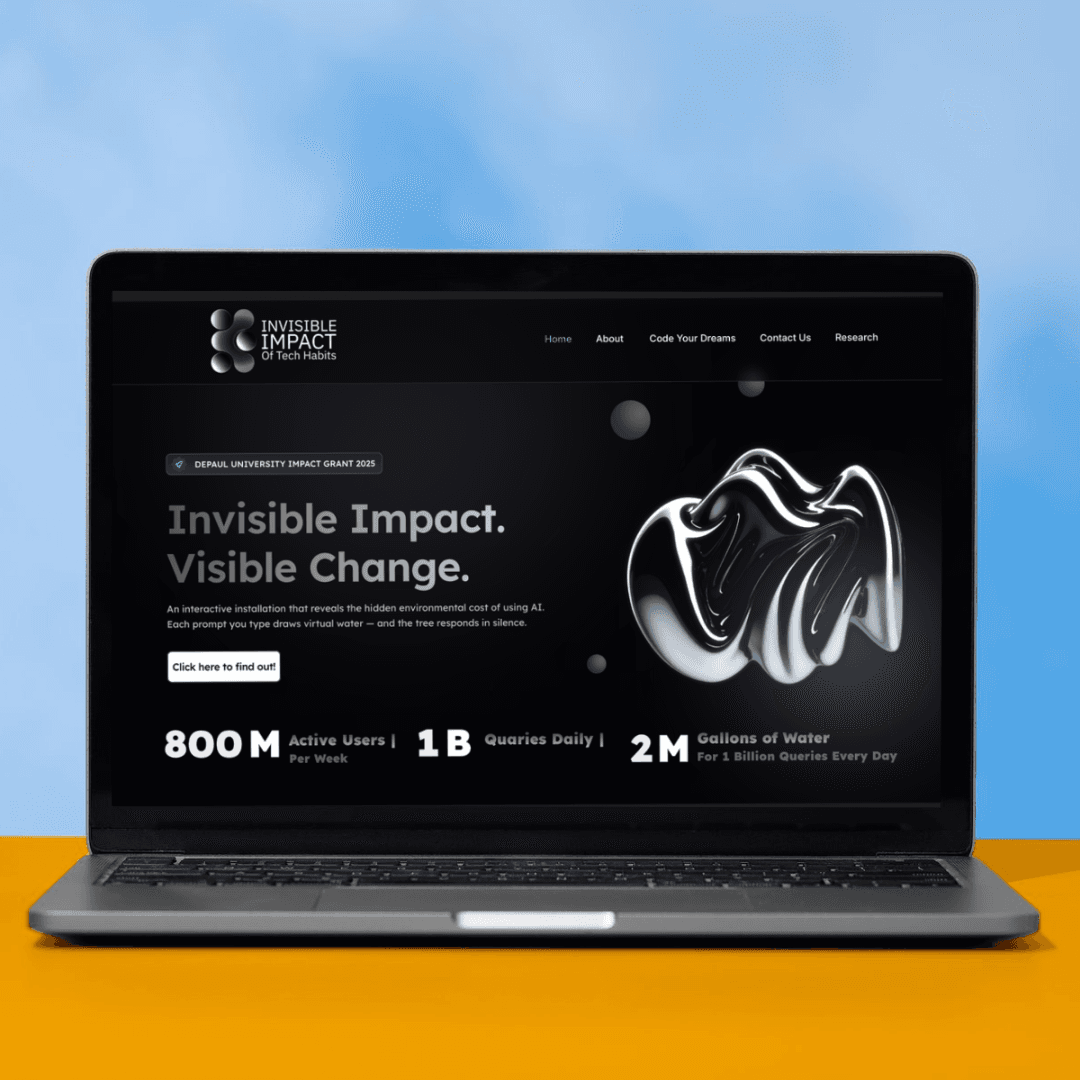
An interactive installation that translates the environmental cost of AI into a physical and digital experience — connecting everyday AI interactions to real-time water and energy feedback.
Instead of asking people to understand an abstract statistic, the installation makes the consequence visible, physical, and immediate.
DePaul Summer Impact Grant 2025 · Winner
- Lead UX Researcher
- 10 weeks
- UX Researcher · UI Designer · Developer · PM
- Figma · Framer · Arduino · VS Code
The outcome
We turned an invisible environmental cost into something people could see and feel.
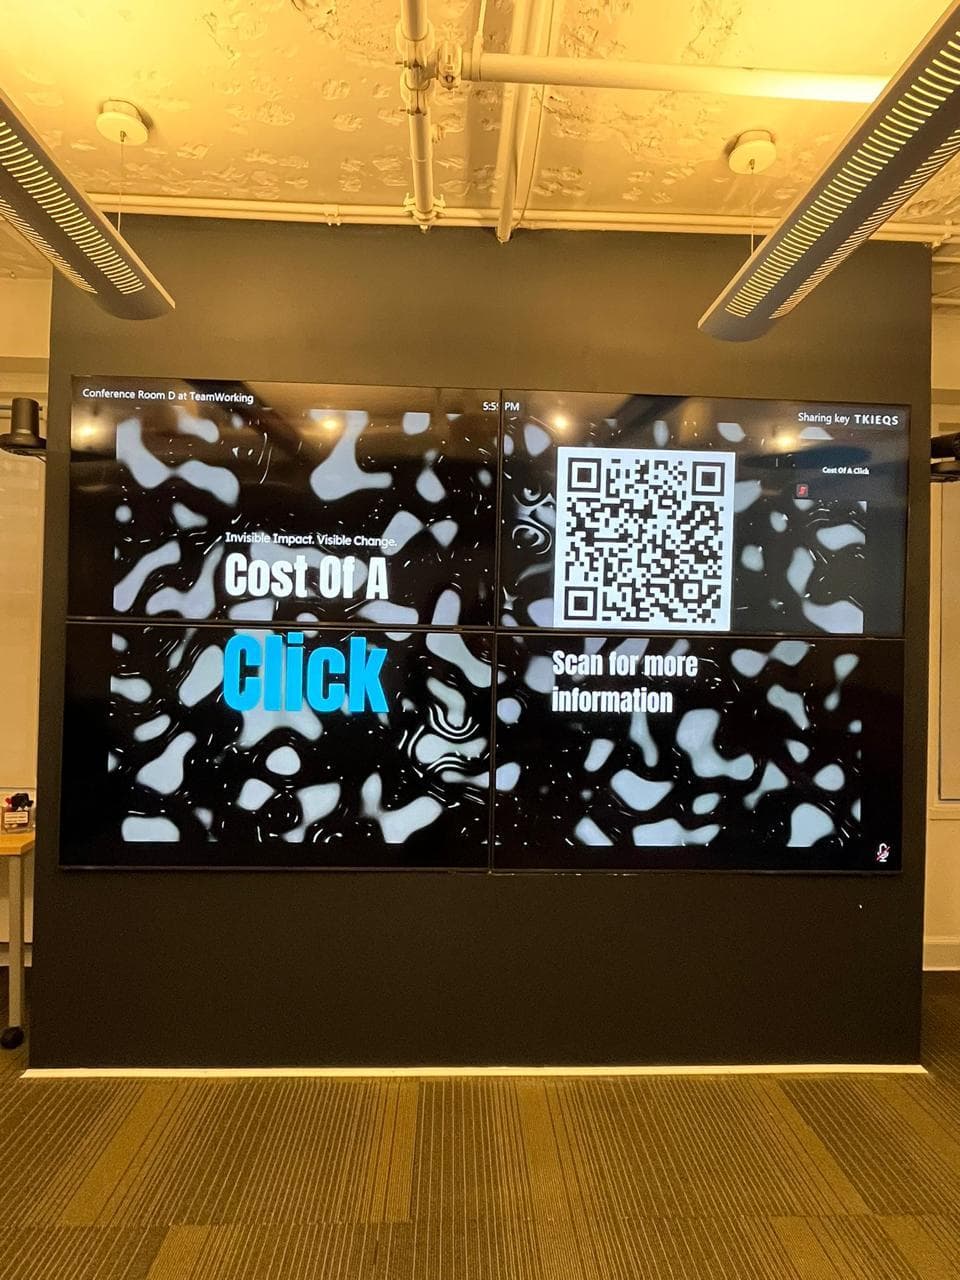
Cost of a Click connected an AI interaction to a physical consequence: visitors used an AI system while the installation translated that activity into real-time water and digital environmental feedback.
The experience was exhibited at the DePaul Summer Showcase 2025, where exit-survey responses showed increased awareness and reported intention to use AI more mindfully.
Abstract
AI has an environmental cost.
Physical
Water moves in response to interaction.
Digital
Environmental impact becomes visible on screen.
Personal
The visitor can connect a system-level cost to their own action.
- reported changed awareness of AI's environmental footprint
- 85%
- reported intent to use AI more mindfully
- 73%
- increase in self-reported informed decision-making
- 30%
- TikTok views after exhibition footage circulated
- 6M+
DePaul Summer Impact Grant — Winner
DePaul Summer Showcase — Featured installation
How to read these: the 85%, 73% and 30% measures are self-reported participant responses. The 6M+ figure represents social reach — not product adoption or verified behaviour change.
The problem
AI feels invisible. So do its environmental costs.
AI depends on physical infrastructure — data centers, energy systems, and water used for cooling — but none of that is visible during a typical AI interaction.
The problem was not a lack of information. It was the distance between what I do → what the infrastructure consumes → what I actually perceive.
“Abstract environmental data doesn’t change behaviour. But when you watch the water pour — you feel it.”

Invisible infrastructure
Data centers · water · energy
Abstract information
Numbers · charts · reports
Everyday AI use
Ask · generate · repeat
The opportunity
Don’t explain the infrastructure. Make people experience it.
The project reframed the challenge from information delivery to experience design. The central hypothesis: a physical consequence could create a stronger connection to an otherwise abstract environmental cost.
Design principle
Sensation over statistics.
Traditional awareness
- Statistic
- Read
- Understand
- Move on
Cost of a Click
- AI prompt
- Physical response
- Digital feedback
- Reflection
Research
Research moved the project from “show the impact” to “make the impact felt.”
- semi-structured interviews
- 15
- survey responses
- 42
- concept directions explored
- 3
- usability test rounds before exhibition
- 2
- Desk research
- 15 interviews + survey n=42
- Journey mapping + synthesis
- 3 concept directions
- Physical + digital prototype
- 2 rounds of testing
The insight
Abstract environmental data was too easy to ignore.
We had to collapse the distance between an AI interaction and the infrastructure supporting it.
That led to the defining experience decision: give the environmental cost a physical form.
One AI interaction
Real-time water response
Digital environmental feedback
Felt cost
The experience
Every interaction creates a visible consequence.
The physical and digital layers were deliberately coupled, so the environmental cost never arrived as a separate educational message alongside the interaction — it was the interaction.
- 01
Ask
The visitor enters or submits an AI query.
- 02
Detect
The system registers the interaction.
- 03
Translate
The interaction is converted into a physical response.
- 04
Experience
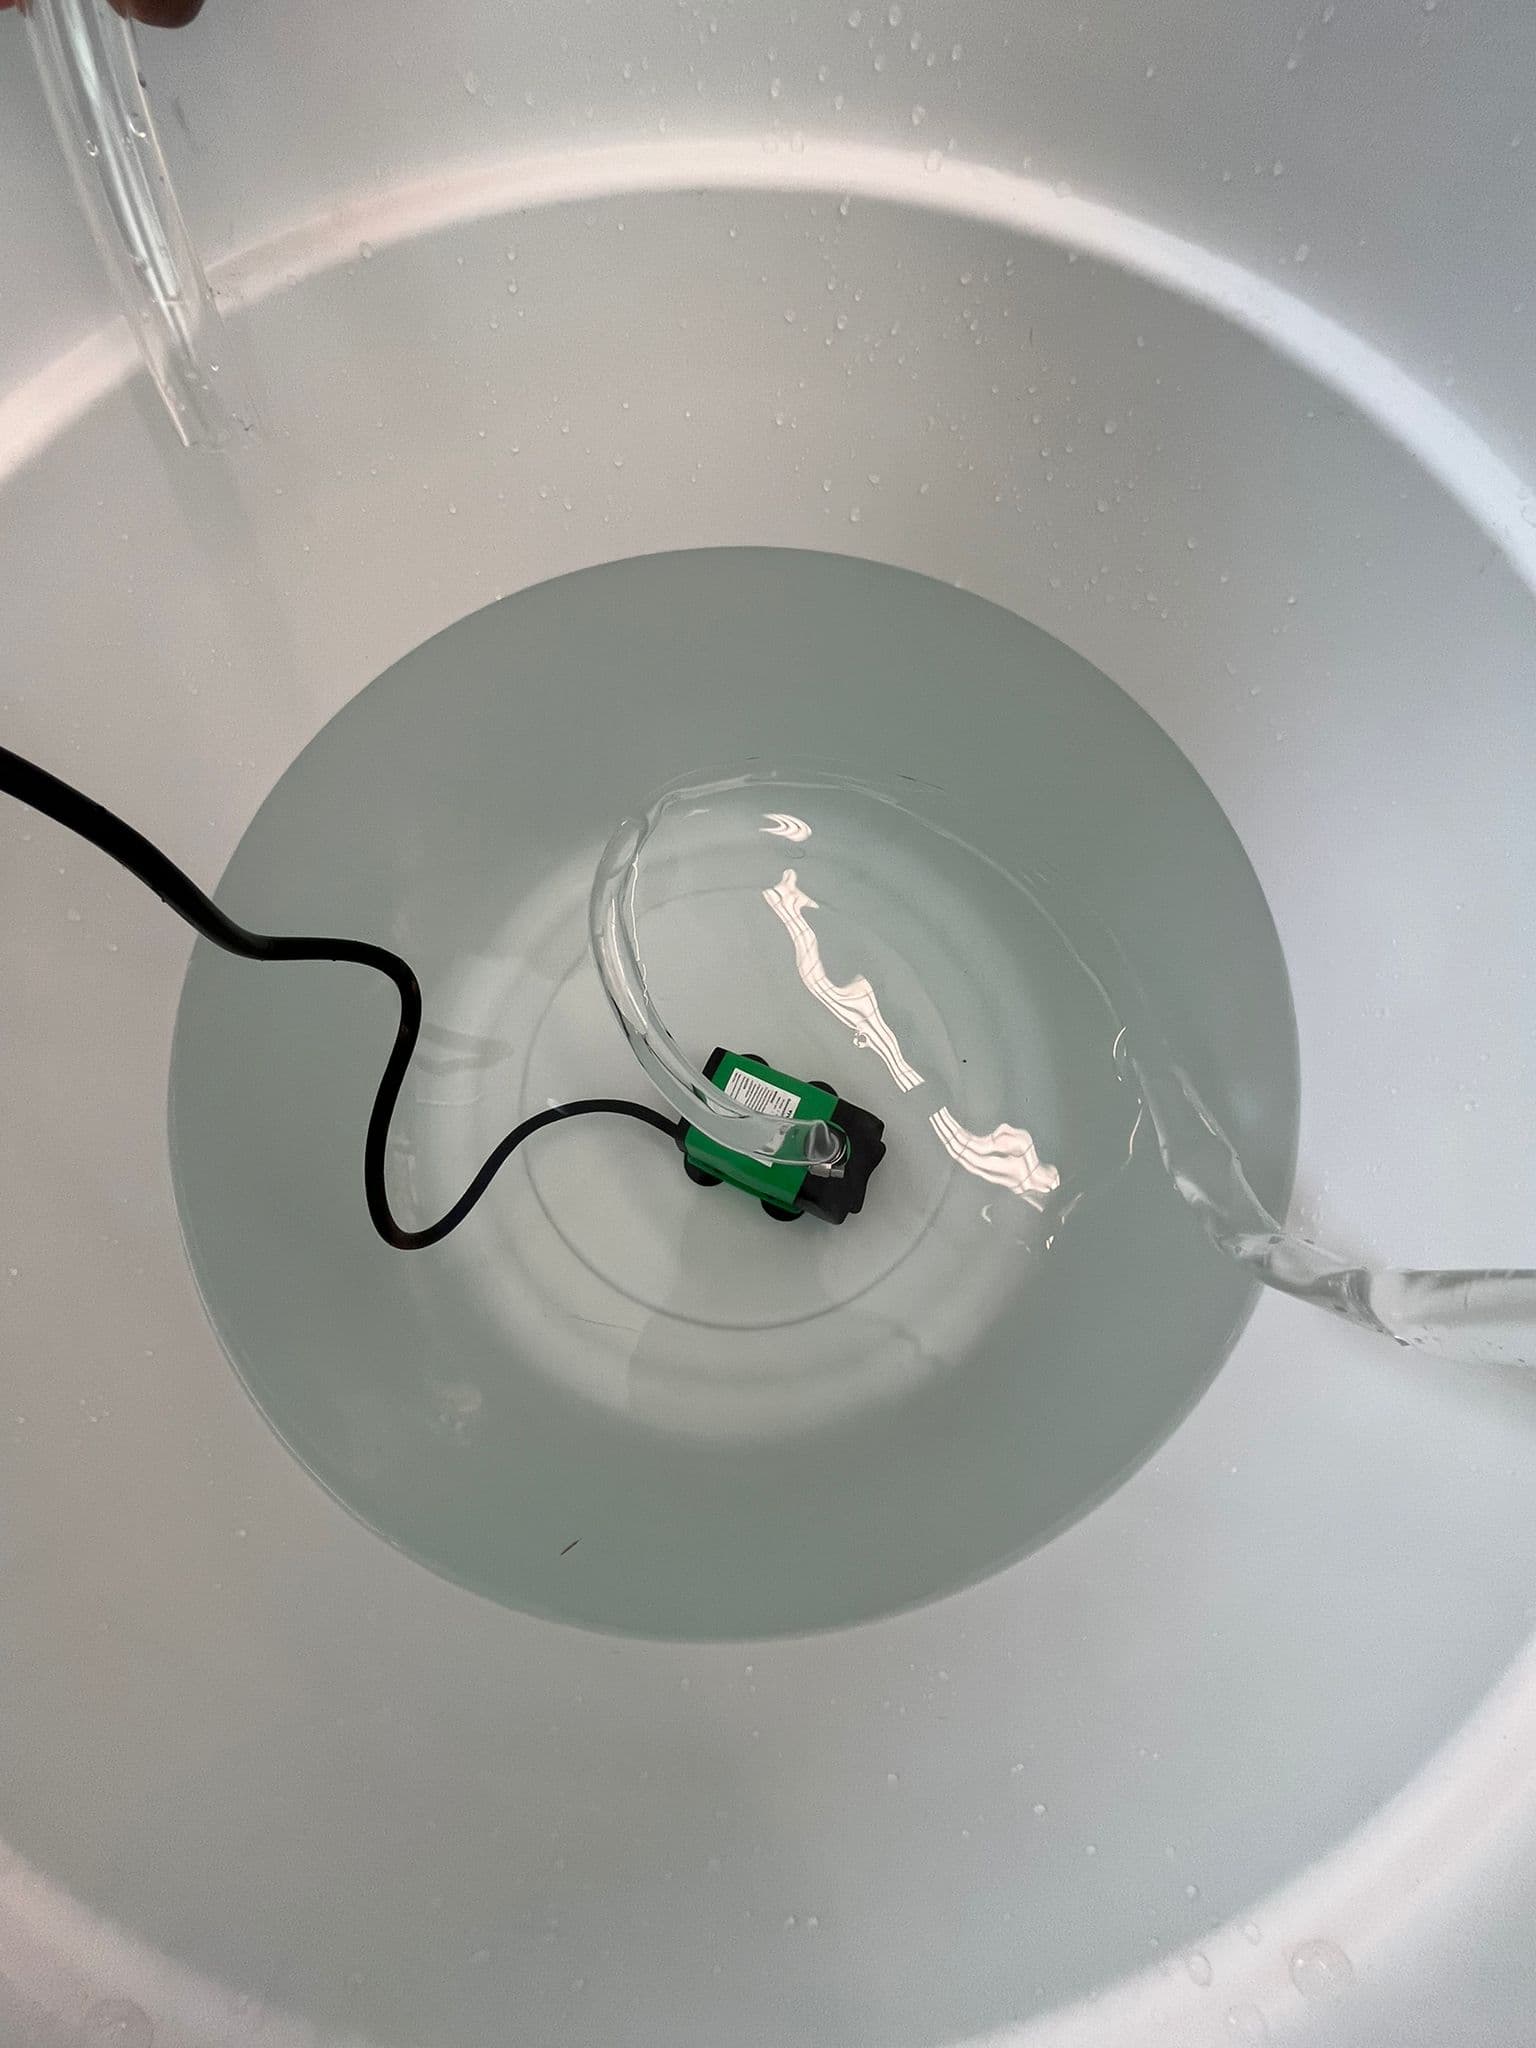
Water moves while the digital interface updates.
- 05
Reflect
The visitor sees the environmental cost behind the interaction.
System design
From prompt to pump.
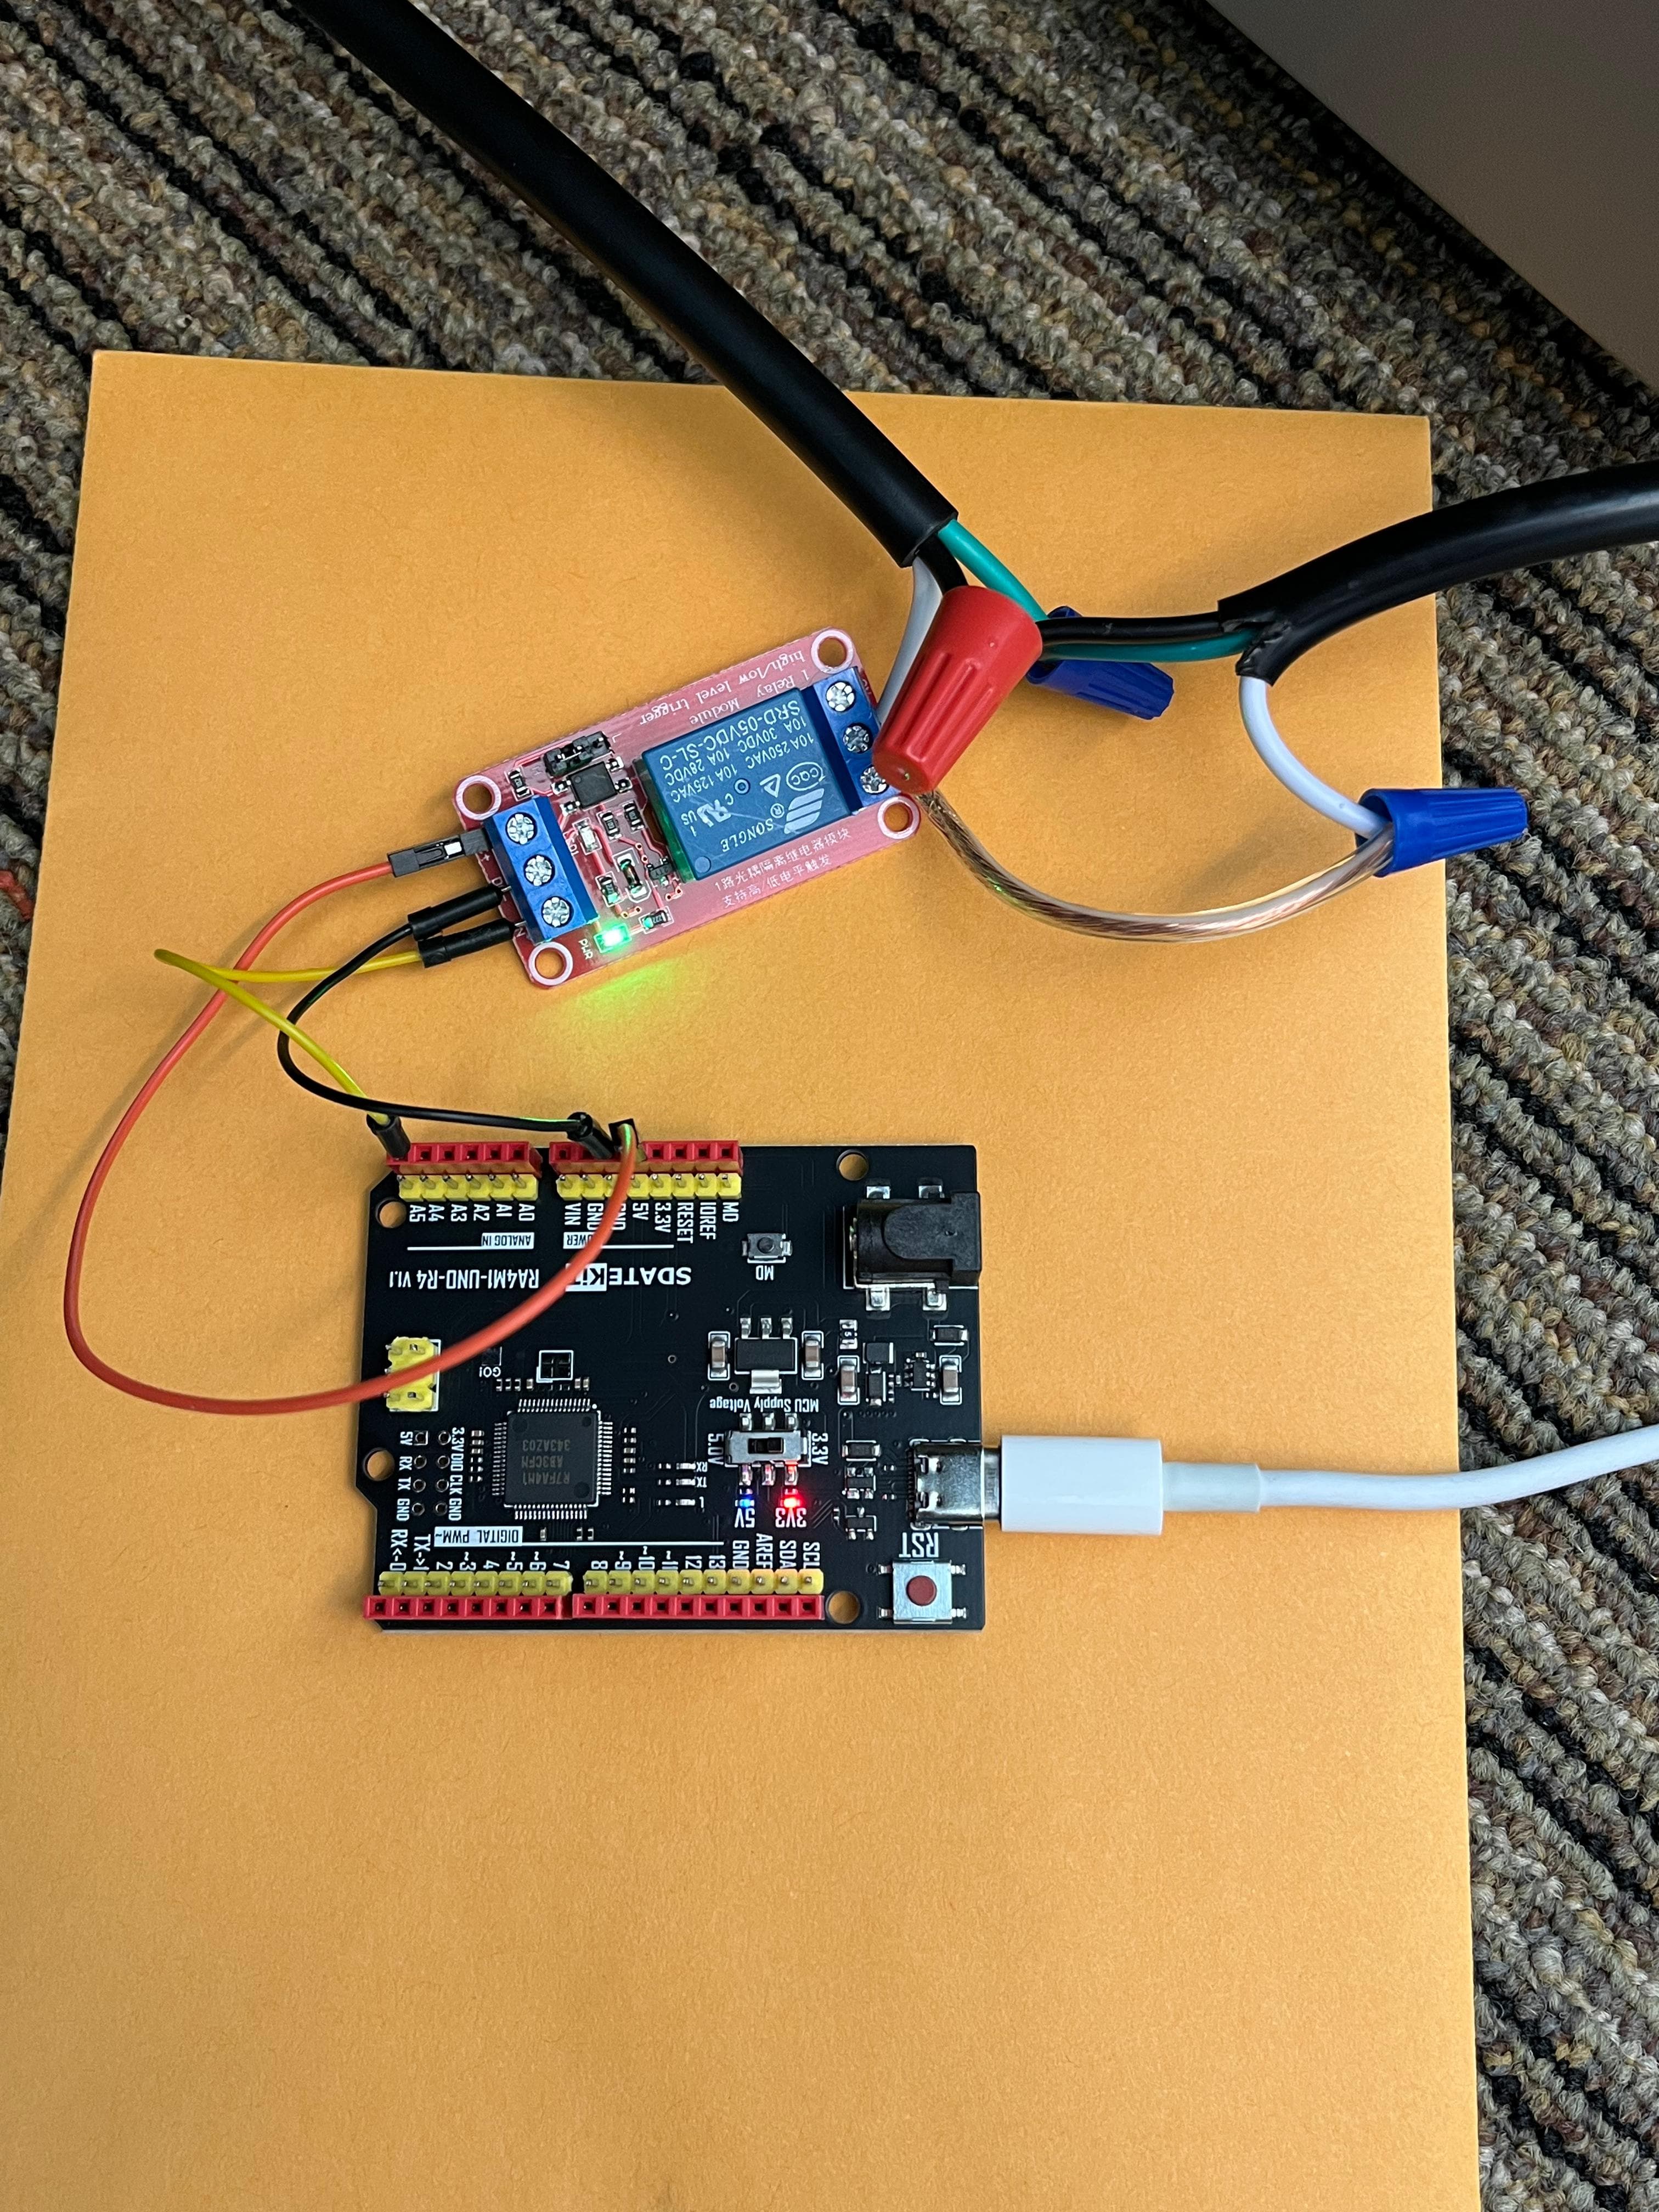
One interaction drove two loops at once. The physical layer made the cost tangible. The digital layer explained what that physical response meant.
Physical loop
- Arduino
- Relay / sensor logic
- Water pump
- Physical water response
Digital loop
- Digital interface
- Real-time environmental feedback
Design rationale
Water gave an invisible system a physical volume.
A number can communicate scale. A physical quantity can communicate consequence.
The installation used real water as a tangible representation of infrastructure people normally never see.
- AI query
- Invisible water use
- Physical water response
- Visible consequence
Secondary metaphor
The digital environment showed what the physical interaction could not.
As visitors interacted, the digital environment added a second layer of consequence through visual change: a tree withering over time to represent the accumulated impact of repeated AI use.
Physical feedback creates immediacy. Digital feedback creates narrative.
Healthy
Stressed
Withering
My role
I connected research, experience design, and physical interaction.
As Lead UX Researcher I led the research process and worked across experience design, sensor interaction, and testing.
The role extended beyond interface design: I translated findings into the physical and digital behaviour of the installation, and helped shape the experience from concept through exhibition.
Research
- Desk research
- 15 interviews
- Survey n=42
- Journey mapping
Experience design
- Problem framing
- Concept directions
- Interaction model
- Information hierarchy
Physical-digital design
- Water interaction
- Sensor behaviour
- Digital feedback
- Arduino integration
Validation
- Lab usability test
- Field test
- Iteration
Exhibition
- Showcase prep
- Audience interaction
- Impact measurement
The process
Research-heavy at the start. Test-heavy at the end.
01Discovery
Desk research · secondary synthesis · problem framing
02User research
15 interviews · survey n=42 · journey mapping
03Concept + design
3 directions · prototyping · Figma flows
04Build
Arduino · sensor integration · water pump
05Test R1
Lab usability test · iteration
06Test R2
Field test · refinement
07Exhibit
DePaul Summer Showcase · impact measurement
Iteration
Testing exposed problems the concept couldn’t.
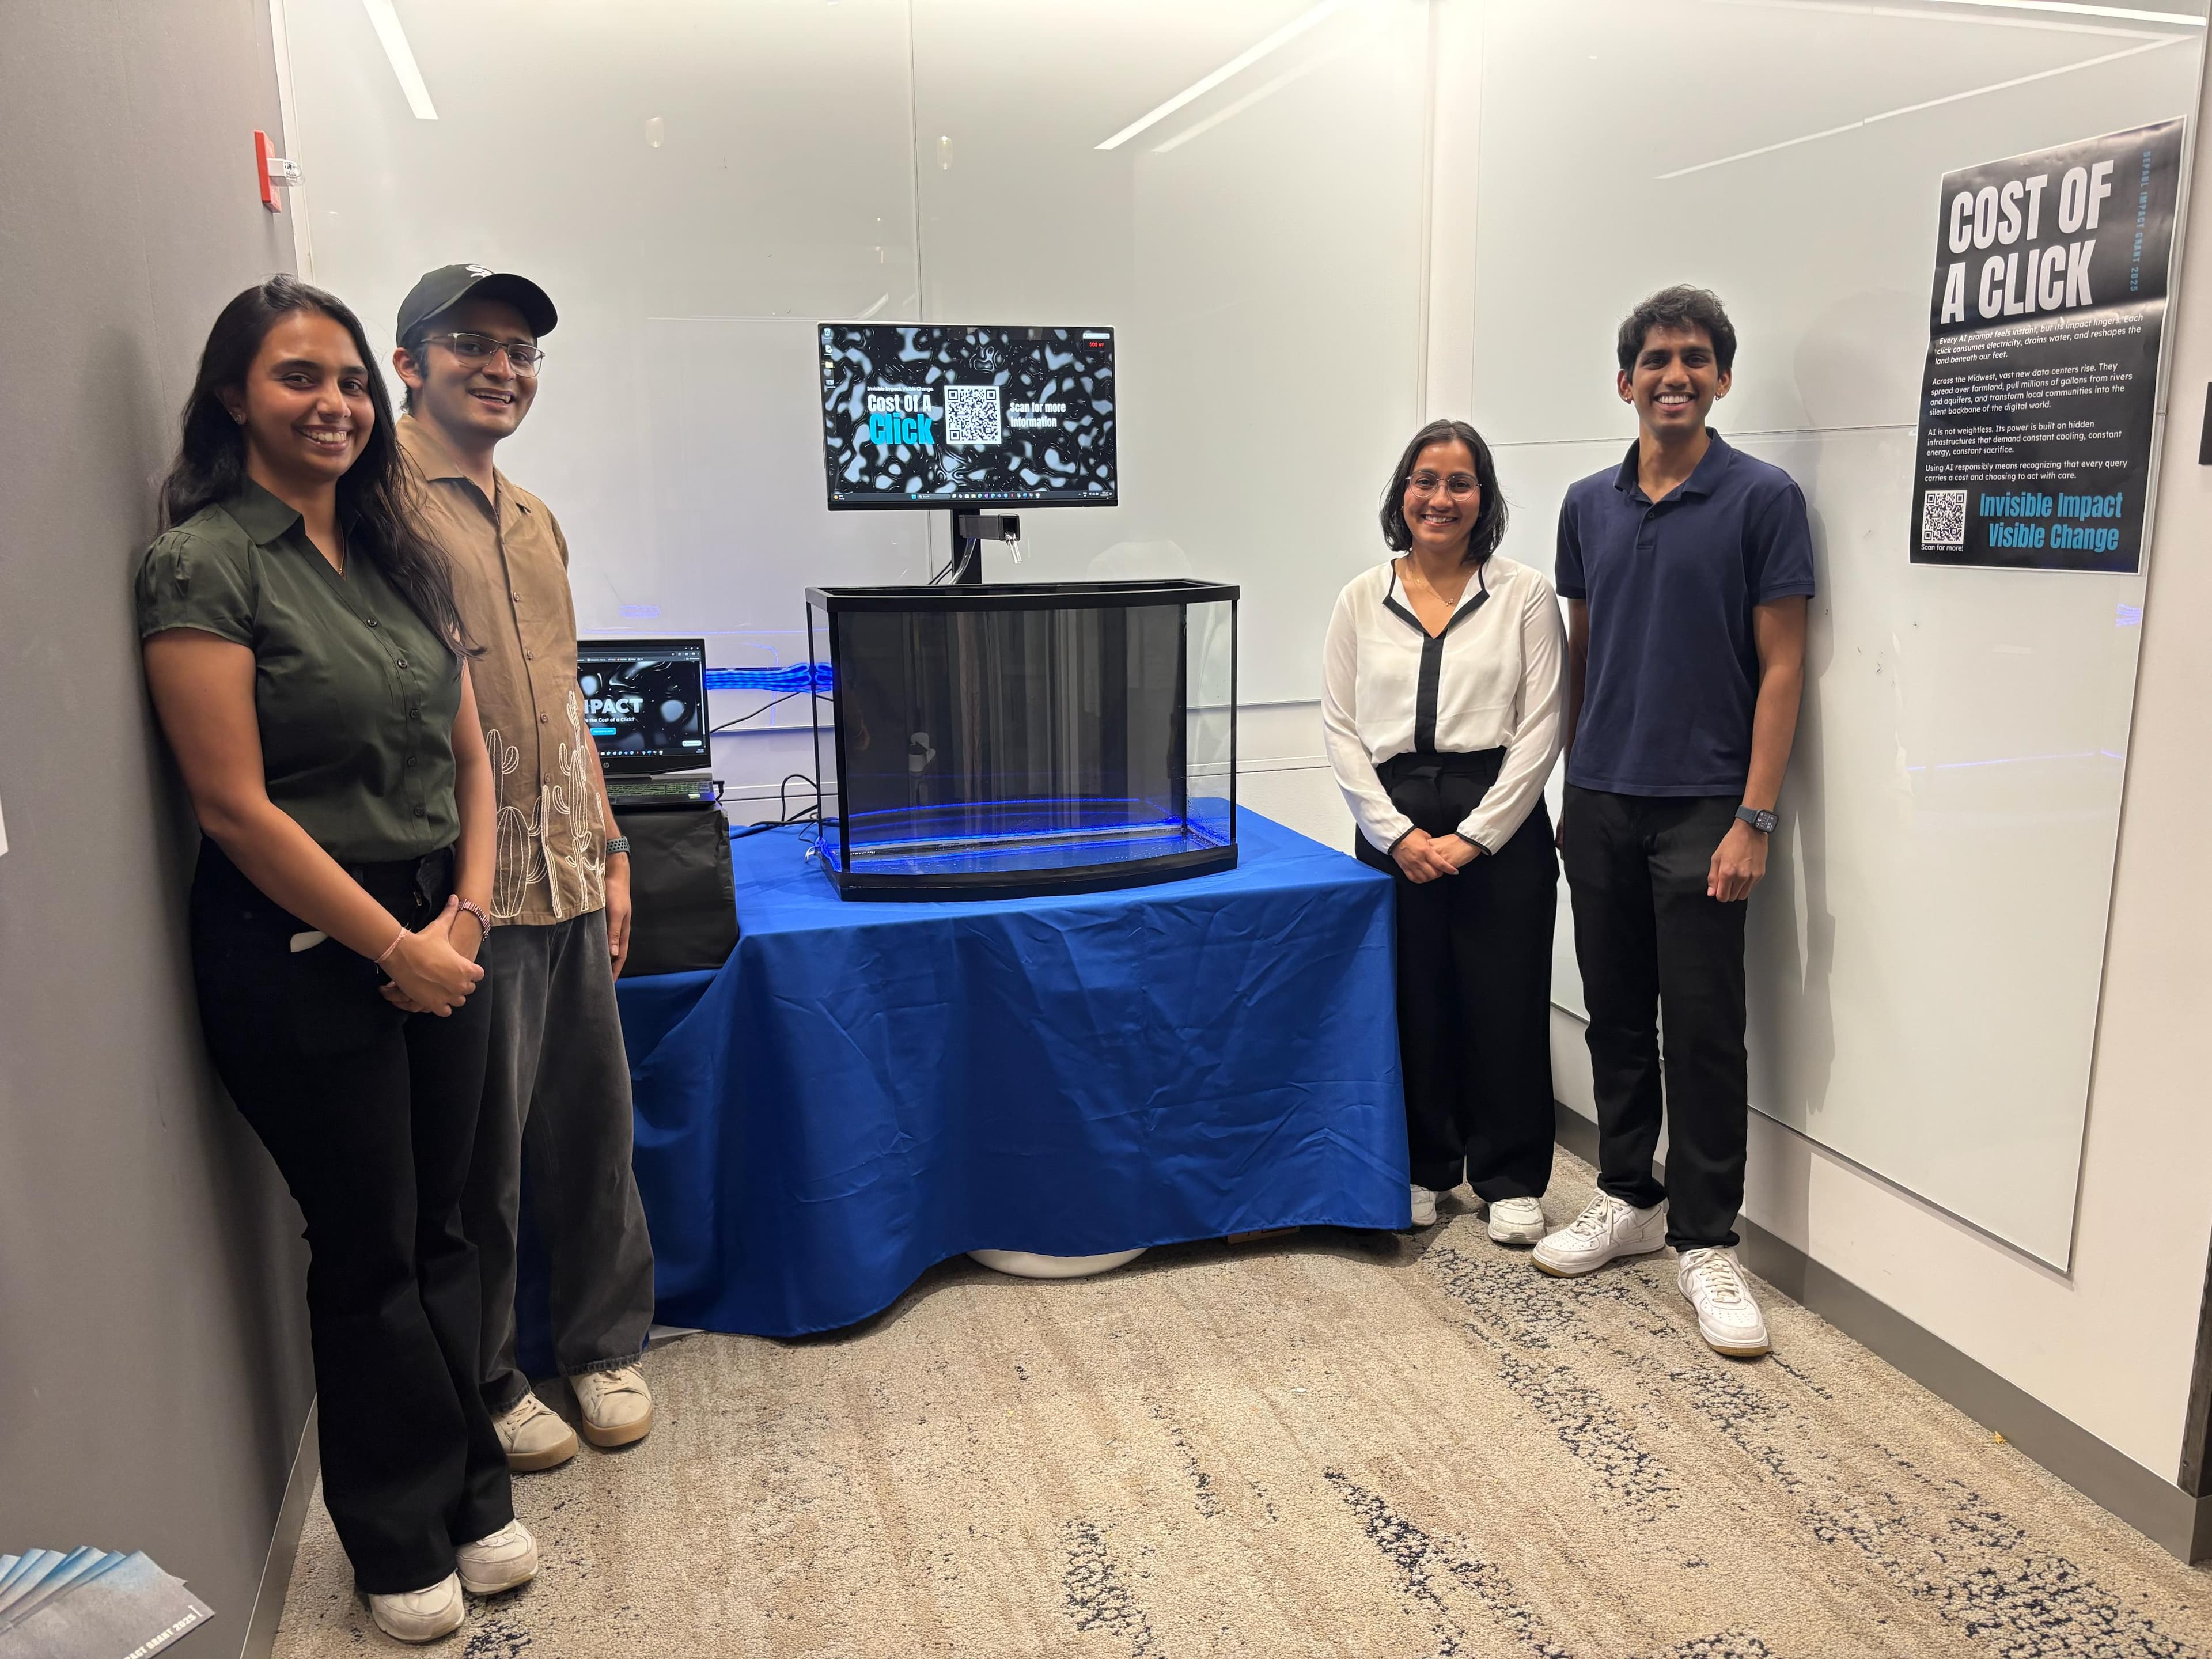
Two rounds of usability testing before the exhibition surfaced physical and interaction friction.
The experience had to work as a physical system, not just as a concept.
Water spillage
Refined the physical setup.
Prompt timing
Adjusted the interaction timing.
Screen readability
Improved the digital hierarchy.
Behind the build
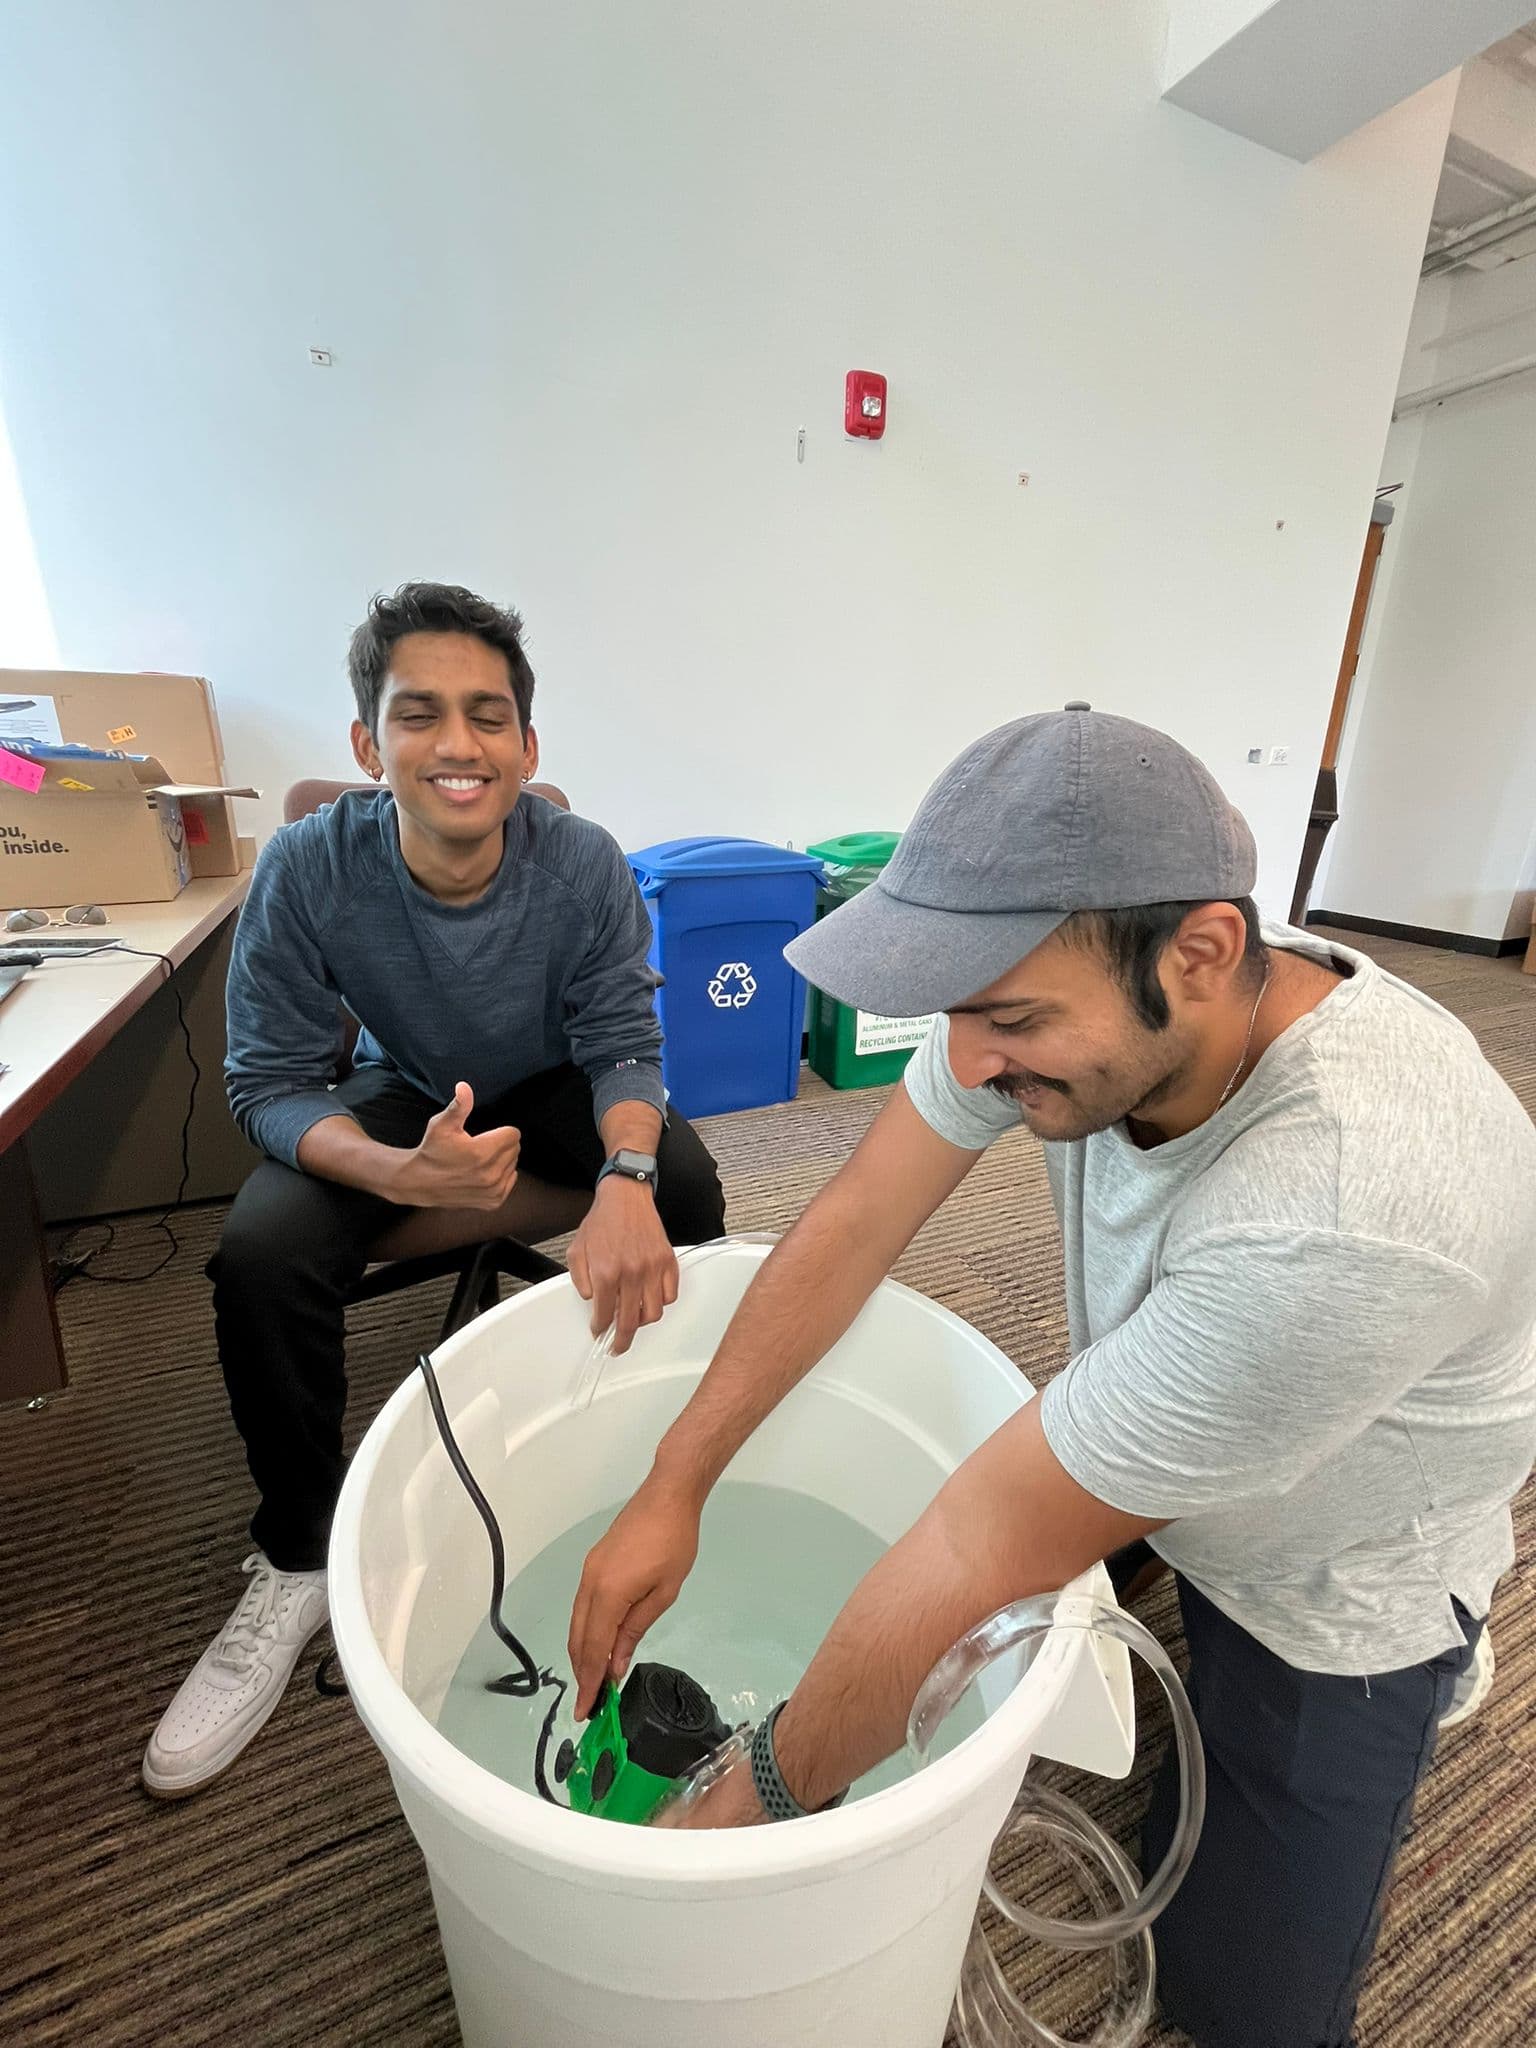
The prototype had a body, a screen, and a feedback loop.
Physical
Water container · pump · tubing · physical feedback
Compute
Arduino · relay · sensor logic
Digital
AI interaction · environmental counter · data visualization
Experience
User action · immediate consequence · reflection
Exhibition
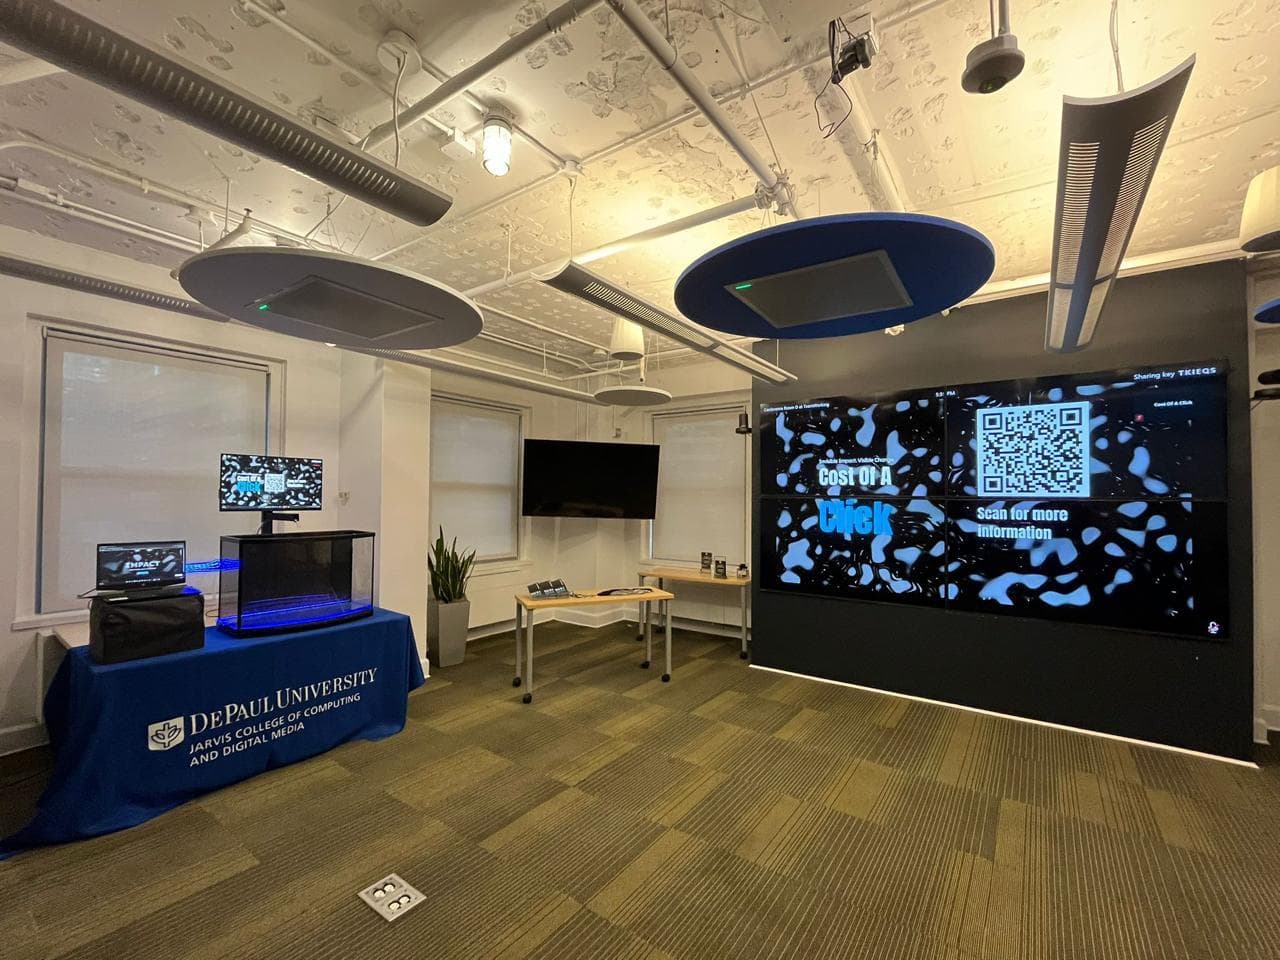
The final test was putting the experience in front of people.
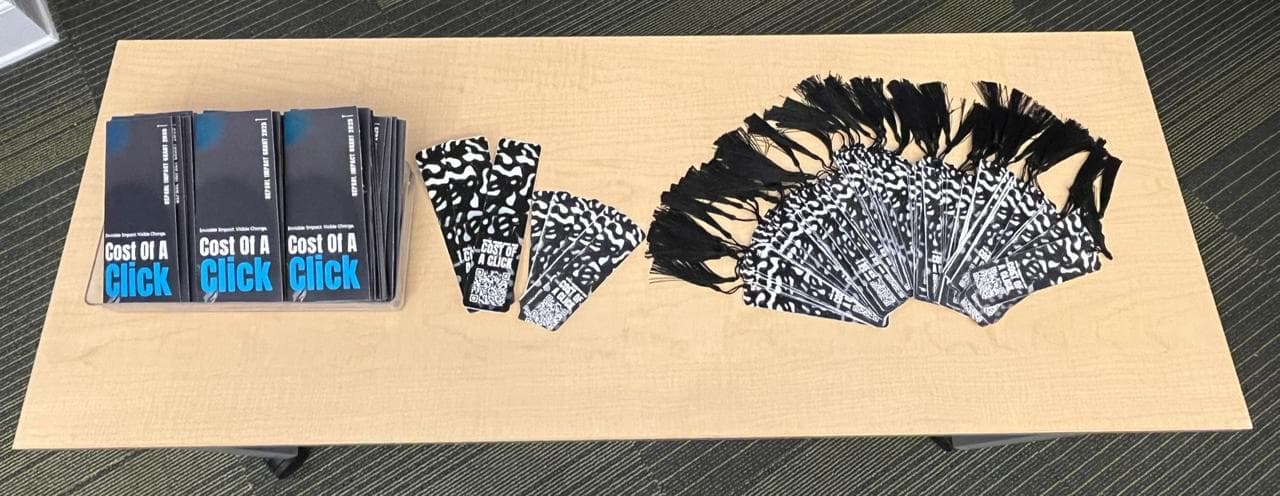
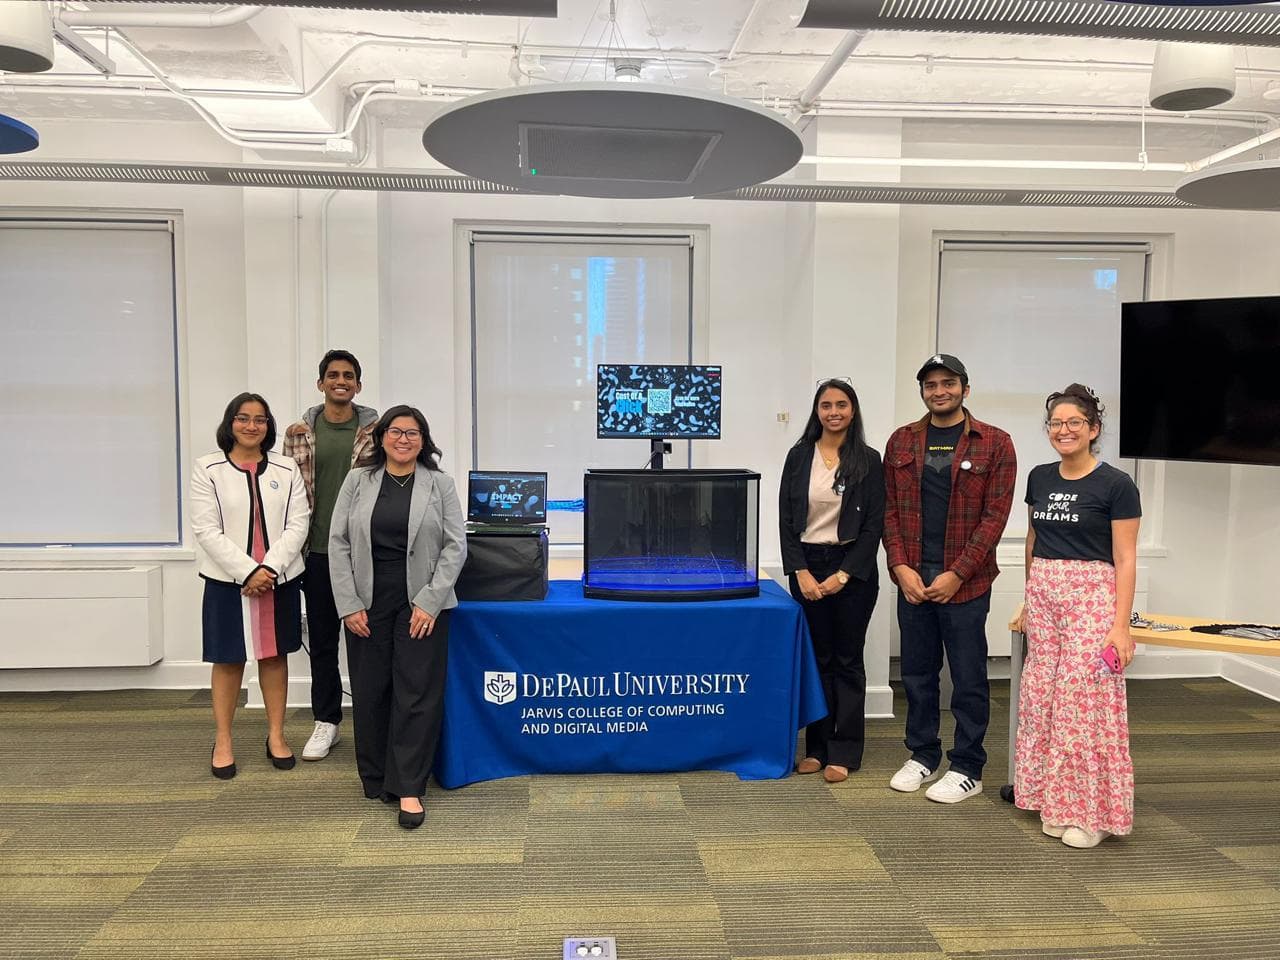
Cost of a Click was exhibited at the DePaul Summer Showcase 2025, where students, faculty and public visitors experienced the installation directly.
Impact
The installation made the invisible visible — and the response was measurable.
The result wasn’t simply that visitors saw a new data visualization. The experience created a stronger connection between AI use and the infrastructure behind it.
- reported changed awareness of AI's environmental footprint
- 85%
- reported intent to use AI more mindfully — specifically reducing unnecessary or casual queries
- 73%
- increase in self-reported informed decision-making about when to use AI tools
- 30%
Qualifier: these outcomes are based on self-reported exit-survey responses. They should not be presented as proof of long-term behaviour change.
Beyond the exhibition
The conversation left the room.
After the DePaul exhibition, footage of Cost of a Click circulated on TikTok and reached more than 6 million views, broadening the public conversation around AI’s hidden environmental cost.
6M+ views measure reach — not adoption, and not behaviour change.
Concept — where this could go next
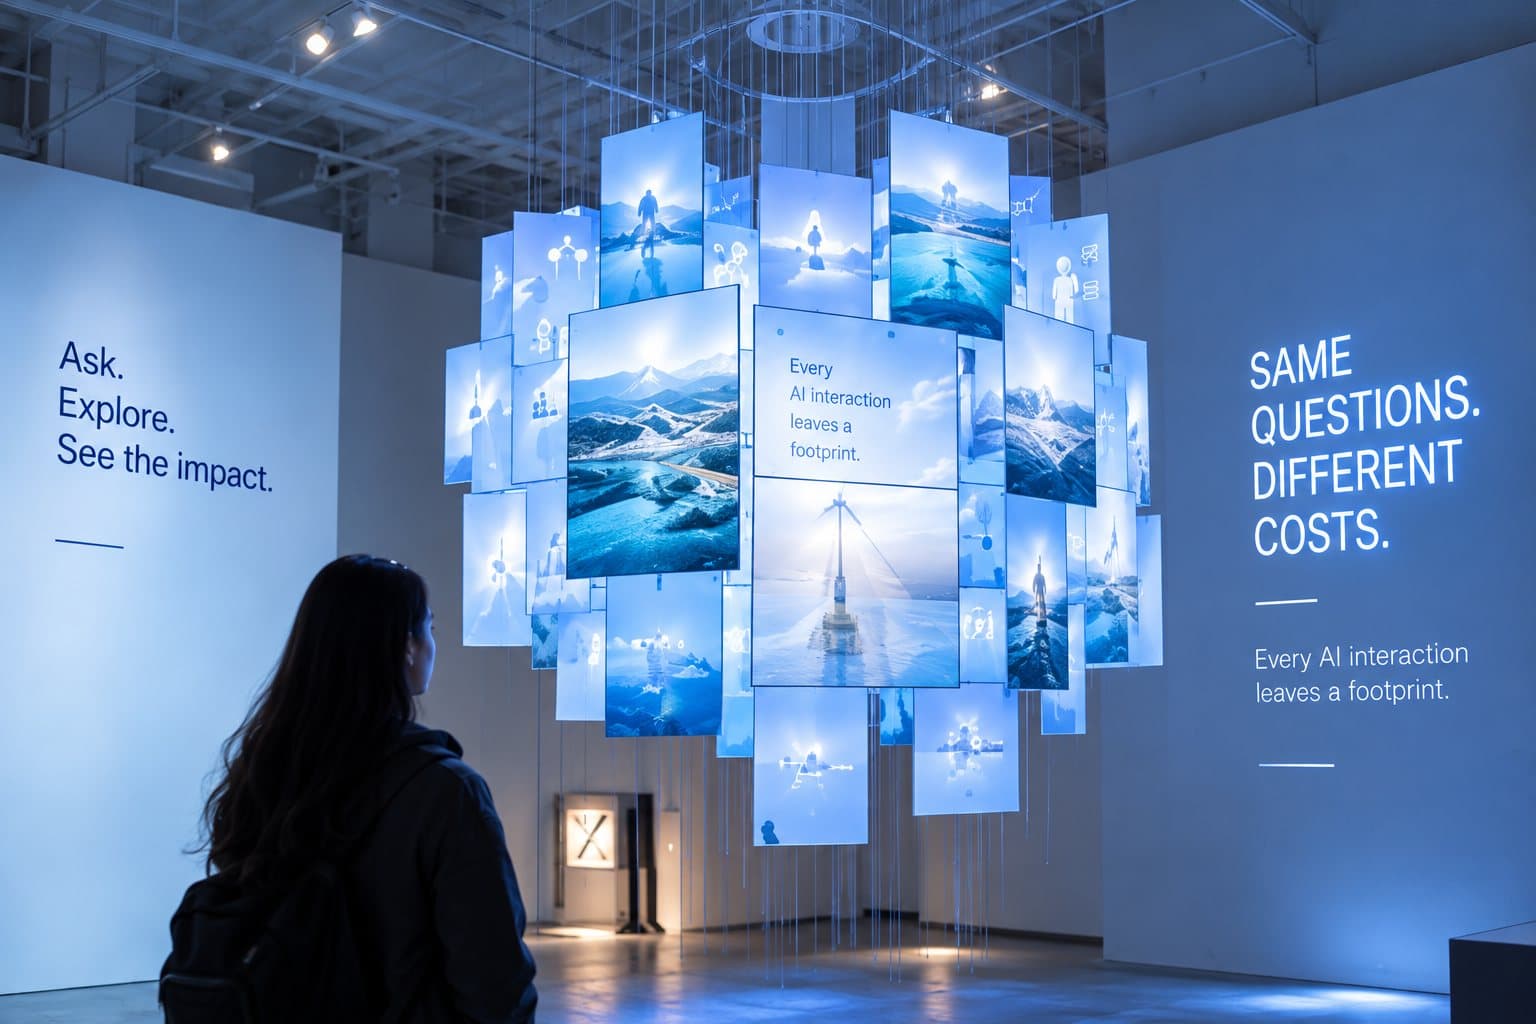
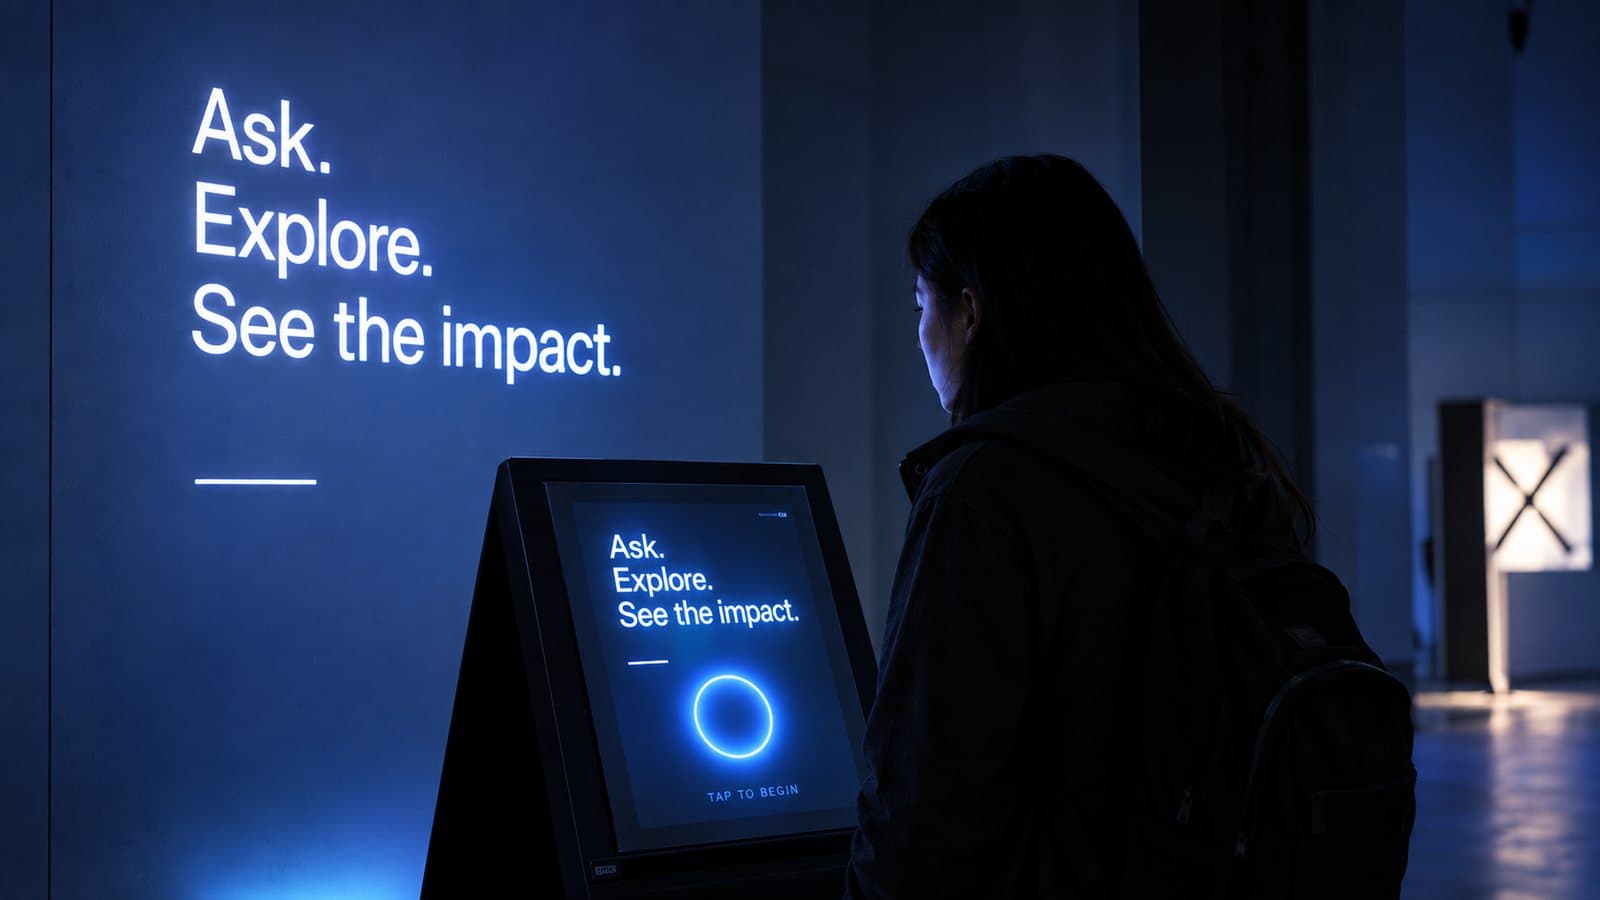
The showcase build was one table, one tank, one pump. These illustrations imagine the same idea at exhibition scale — a room a visitor walks into rather than a station they walk up to.
Capabilities
This wasn’t just a sustainability installation.
UX research
Interviews · survey · synthesis · testing
Experience design
Interaction model · information hierarchy · physical-digital journey
Systems thinking
AI interaction → sensor → physical response → digital feedback
Prototyping
Figma · Framer · Arduino · VS Code
Physical computing
Pump · relay · sensor interaction
Public-facing design
Exhibition · audience testing · impact measurement
Key takeaways
Design the experience, not just the information.
Felt information is different
Physical feedback created a different kind of environmental awareness than a static number.
Research can shape hardware
Research influenced the physical interaction, not just the screen design.
Physical systems need different testing
Water spillage, timing, spatial setup and readability all became UX problems.
Ethical framing matters
Inform without relying on fear, and leave people with something actionable.
Continuing research
The installation became a research platform.
Further work on the project developed into a paper on interactive art as a public-facing AI ethics interface.
- Installation
- Research evidence
- Academic paper
Cunningham, J. L., Iqbal, S., Nacu, D., Caplan, B., Yerramilli, R., & Mukkamala, D. D. (2026). “Making AI Infrastructure Visible: Interactive Art as a Public-Facing AI Ethics Interface.” AAAI/ACM Conference on AI, Ethics, and Society (AIES 2026).
Final thoughts
The invisible has a cost. Let’s make it visible.
Cost of a Click started with a communication problem: people could understand AI’s environmental impact without ever feeling connected to it.
The project turned that abstract cost into an experience — something people could see, touch, question, and remember.
About me